XDebug is a great PHP extension that allows us to debug and profile our code. Yes, we can for sure use var_dump but this is very limited. On another note, I have already been using Vagrant for local development for a number of weeks already and how happy am I in finding about this. Using Vagrant somehow limits the surprises that XAMPP or any other package spits out especially when you are stuck with Windows. For example, you’ll never have to anymore experience the prevalent problem with directory separators.
So, after hours of scouring the Internet and somes head-scratching moments, I have finally found a way in making XDebug on Vagrant work nicely with PHPStorm.
PuPHPet Configuration
I have used PuPHPet in generating the Vagrant instance configuration. For comparison purposes, below is the XDebug configuration found in PuPHPet’s config.yaml.
xdebug:
    install: '1'
    settings:
        xdebug.default_enable: '1'
        xdebug.remote_autostart: '1'
        xdebug.remote_connect_back: '1'
        xdebug.remote_enable: '1'
        xdebug.remote_handler: dbgp
        xdebug.remote_port: '9000'
        xdebug.idekey: vagrant
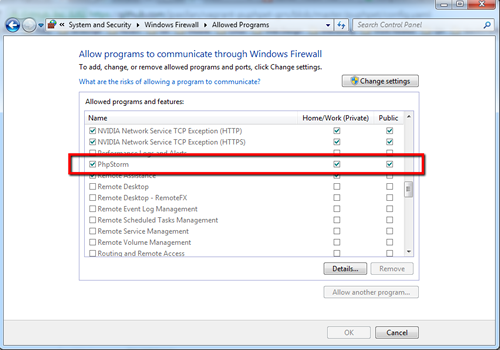
Windows Firewall
It took a lot of time before I figured it out that the Windows firewall have been blocking PhpStorm from listening to debug connections. Make sure that PhpStorm is allowed through the firewall by checking all of its checkboxes, including public access.
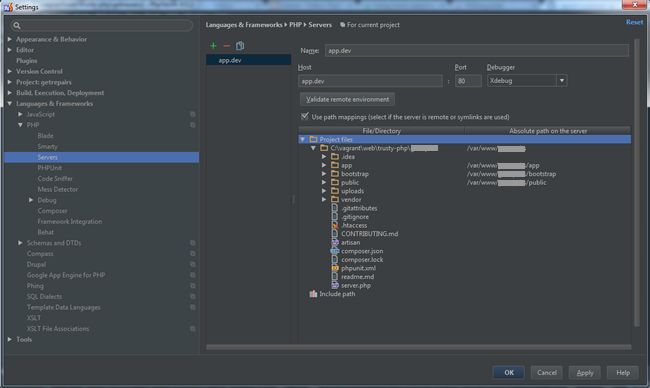
PhpStorm Settings
Configure PhpStorm by first adding a PHP server (in PHPStorm 8, it’s in File > Settings > Languages & Frameworks > PHP > Servers). It is essential that the host, port, and path mappings are correctly provided.
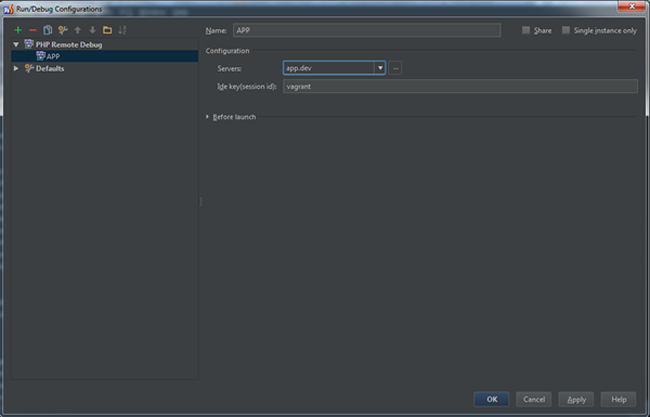
Next, add a PHP Remote Debug configuration (Run > Edit Configurations). Select the server that you had just added and provide the IDE key which should be the same as what is provided in xdebug.idekey in the config.yaml file.
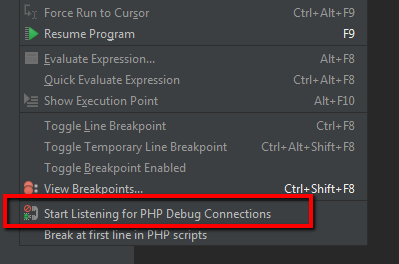
Run A Debugging Session
It is now possible to run a debugging session. After adding breakpoints, set PhpStorm to listen to PHP Debug connections (Run > Start Listening for PHP Debug connections). Then, fire up a browser and open the site to be debugged.
I hope that this have helped you.
